

Data and study population
This study used data from the 2021 Korea Community Health Survey (KCHS), a cross-sectional survey conducted annually by the Korea Disease Control and Prevention Agency (KDCA). The KDCA uses the computer-assisted personal interview method to perform in-person interviews with a sample representative of the Korean population. The study population was selected from national census data using a stratified, multistage, probability cluster sampling method [14]. The KCHS data consisted of 229,242 individuals, in which 74,492 individuals were aged 65 years or above. Of the 74,492 individuals, those with missing values on the outcome variable or the variables were excluded from the study population. The final study population included 58,568 individuals (Fig. 1).
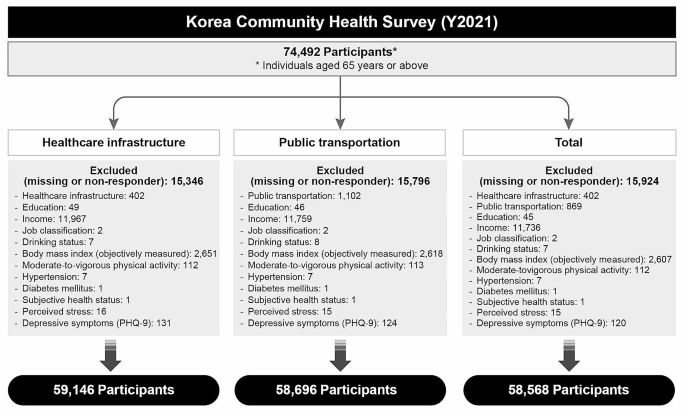
Flow-chart of study participants selection process
Outcome measure
The outcome measure was satisfaction with the healthcare infrastructure and public transportation available nearby in the municipalities in which the participants resided. This was measured using the following questions: “Are you satisfied with the healthcare infrastructure (community health center, clinics and hospitals, and pharmacies) available in your residing neighborhood?” “Are you satisfied with the available public transportation (bus, taxi, subway, or train)? respectively.” Participants responded to these questions with either “yes” or “no.”
Independent variables
The main independent variable was the population decline status of 255 municipalities in Korea, which was measured using the Population Decline Index. The “Special Act on Balanced National Development” was introduced by the government in 2016 to cope with the issue of population decline in rural municipalities. Based on this Act, the Ministry of Public Administration and Security reports on municipalities facing population decline, which is measured based on the summation of changes in the average annual population growth rate, population density, net youth (individuals aged 19–34) mobility rate, daytime population size, aging (individuals aged 65 or above) rate, youth proportion (individuals aged < 14) rate, crude birth rate, and financial independence of the municipality (Supplementary Table 1). The 2021 report classified 89 municipalities with population decline and 18 municipalities at risk of population decline (Fig. 2). This study categorized municipalities into three groups based on this index: “municipalities without population decline,” “municipalities at risk of population decline,” and “municipalities with population decline.” The Population Decline Index was successfully evaluated in a previous study [15].

Municipalities categorized according to the Population Decline Index
Various covariates were considered in this analysis. The included variables were sex (male or female), age (65–69, 70–74, 75–79 or 80 + years), educational level (none, elementary school, middle school, high school, or college or above), income (quartiles), job classification (professional or administrative position, office work, sales and service, agriculture and fishery, blue collar work or simple labor, or unemployed), smoking status (no or yes), monthly drinking (no or yes), Body Mass Index (BMI; underweight, normal, or obese), moderate to vigorous levels of physical exercise (no or yes), hypertension (no or yes), diabetes (no or yes), subjective health status (poor or fair), perceived stress (no or yes), and depressive symptoms (no or yes). A BMI of < 18.5 was categorized as underweight, 18.5≤, < 25.0 as normal, and ≥ 25.0 as obese [16]. Depressive symptoms were defined based on the Patient Health Questionnaire-9, which ranges from 0 to 27 with a cutoff score of 10 [17].
Statistical analysis
The chi-square test was used to examine the general characteristics of the study population. The association between satisfaction with nearby infrastructure and residing in municipalities facing population decline was analyzed using a multilevel logistic regression analysis. The null hypothesis was examined in Model 1, individual-level factors in Model 2, and both individual- and municipal-level factors in Model 3. A random intercept model with municipality as a level 2 variable was used in the full fitting model. The latent variable method of intra-cluster correlation (ICC), Median Odds Ratio (MOR), and proportional change in variance were used to reveal the variation measures that infer random effects. Specifically, the MOR is a useful measure to interpret the magnitude of the contextual effect [18, 19]. The goodness of fit was compared between models using the − 2 log likelihood test, Akaike Information Criteria (AIC), and Bayesian Information Criteria (BIC). From this, Model 3 was shown as the best fitting model. Results are presented as Odds Ratios (OR) and 95% Confidence Intervals (CI). Statistical significance was set at p < 0.05. All analyses were conducted using SAS software (version 9.4, SAS Institute, Cary, NC, USA).
Ethical approval
The Korea Community Health Survey (KCHS) data are openly published. Participant’s data were fully anonymized prior to release. Our study was excluded from the review list pursuant to Article 2.2 of the Enforcement Rule of Bioethics and Safety Act in Korea, since the data was exempted from IRB review. All procedures performed in studies involving human participants were in accordance with the ethical standards of the national research committee and with the 1964 Helsinki declaration and its later amendments or comparable ethical standards.
link